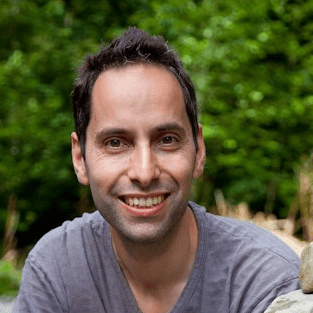
How did you find your way into your current role?
I have been at the Financial Times (FT) since I left college in 1996. I studied scientific / medical illustration at Middlesex University and was lucky enough to get a work placement for 6 weeks in the newspaper’s graphics department. I guess I made an impression as I was hired 2 weeks later and have been there ever since. I worked in print graphics until 1999 when I decided it was time to move into the digital arena on FT.com. We were predominantly producing graphic illustrations / charts and photos for the website and in 2007 the interactive desk was formed – this is when I started learning coding, predominantly in Flash until 2012 when we switched over to HTML / CSS / JavaScript.
How is the newsroom changing?
The newsroom has evolved dramatically over the past decade, going from a predominantly print oriented operation to a much more web-focused one. Social media and web analytics have also become a much larger part of day-to-day life in the newsroom. These tools give us insights into what is popular with our readers, and at what time of day, helping us to tailor our web production cycles.
What do you enjoy most about your role?
What I love most about my role is that I am constantly learning new things. The web doesn’t stand still and you can’t afford to relax. I always try and find something new to learn on each project that I do. Whether it is trying out a new piece of software or experimenting with a different visual approach. I’m lucky to have the creative freedom to do this in my day job.
And what do you enjoy least?
To be honest there’s very little I don’t like about this job. Even when you’re under extreme pressure because of a breaking news story, I get a buzz from it. Working under pressure is actually something I enjoy.
Who in your field has particularly inspired you, and why?
There are many people who have inspired me. Edward Tufte to me is the data visualisation godfather. His book The Visual Display of Quantitative Information was my bible when I was starting out at the FT. This book was published 35 years ago but its rules are still applicable today. My mentor when I first started at the FT was Bob Hutchinson. He was the sole cartographer in our department, and he definitely rekindled my love of map-making. In those days we would create maps by hand, scan them in then redraw them in Adobe Illustrator. A far cry from today’s modern GIS approach!
How important is data visualization to your newsroom, and how do you see it changing over the next 5 years?
Data visualisation has always been important to the FT. No other newspaper produces as many as we do on a daily basis. How we approach these visualisations has changed over the years as styles change. I see data vis as becoming ever more important to the newsroom, a good visualisation can invariably tell the story in a clearer way than words could ever do. Since Alan Smith has joined the FT as data visualisation editor, our output has become ever more sophisticated and original as we have expanded our visual vocabulary, mainly with the introduction of d3 into our daily workflow.
"I see data vis as becoming ever more important to the newsroom, a good visualisation can invariably tell the story in a clearer way than words could ever do."
What advice would you give to someone starting out in the newsroom?
Never stop learning, keep up-to-date with what the competition is doing and what the latest trends are. Experiment with different ways of storytelling and take advantage of all the tools that are available to the modern-day journalist. I would say it’s almost essential these days to at least have a basic understanding of coding as it will help you find interesting stories in datasets that are waiting to be unlocked.
When you are not working, how do you relax?
I’m a bit of a nature lover so enjoy walks in the countryside, travelling when possible and I have a passion for Formula One. I try and get to see the race in Spa every year. I’m also a keen photographer.
In an alternate life, what would you do for a living?
As I have a love of photography I would have to say a photojournalist as this would take me to far flung places and I would still get to tell stories visually.

About Steve Bernard
Steve Bernard is an expert in data visualisation. Steve has worked at the FT since 1996. Steve’s 21 years at the FT has taken him from the graphics department to the interactive desk, where he has been interactive design editor for 10 years.


